Procurement & Margin Intelligence Dashboard
A single dashboard that shows a multi-location manufacturer exactly where its margin comes from — rebuilt automatically every night, with live commodity-price signals for the buying team. Built solo, running in production.
The problem
A multi-location manufacturer I worked with couldn't answer a question that sounds simple: which of its products actually make money? The cost of making each product was recorded in several different places in the company's core business software — its ERP — and those numbers rarely agreed. Production costs, stock-ledger costs and transfers between sites all told slightly different stories, so comparing margins across product lines or years meant days of manual spreadsheet work — with no in-house IT team to fix it.
What I built
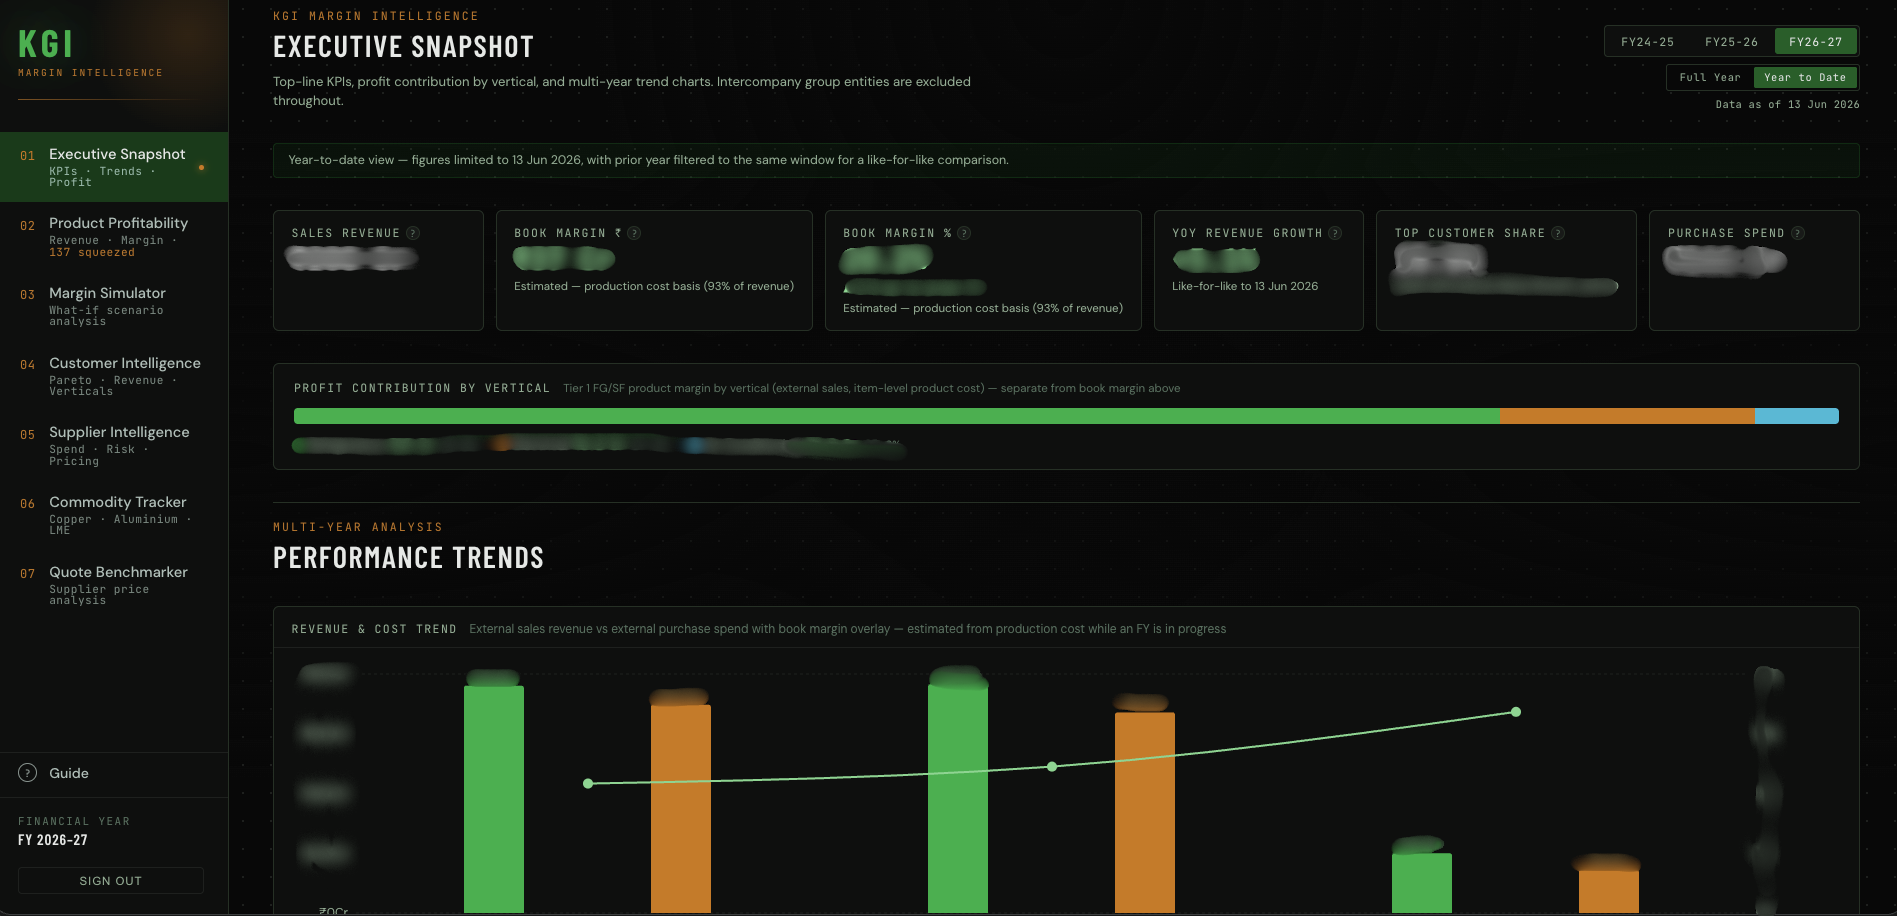
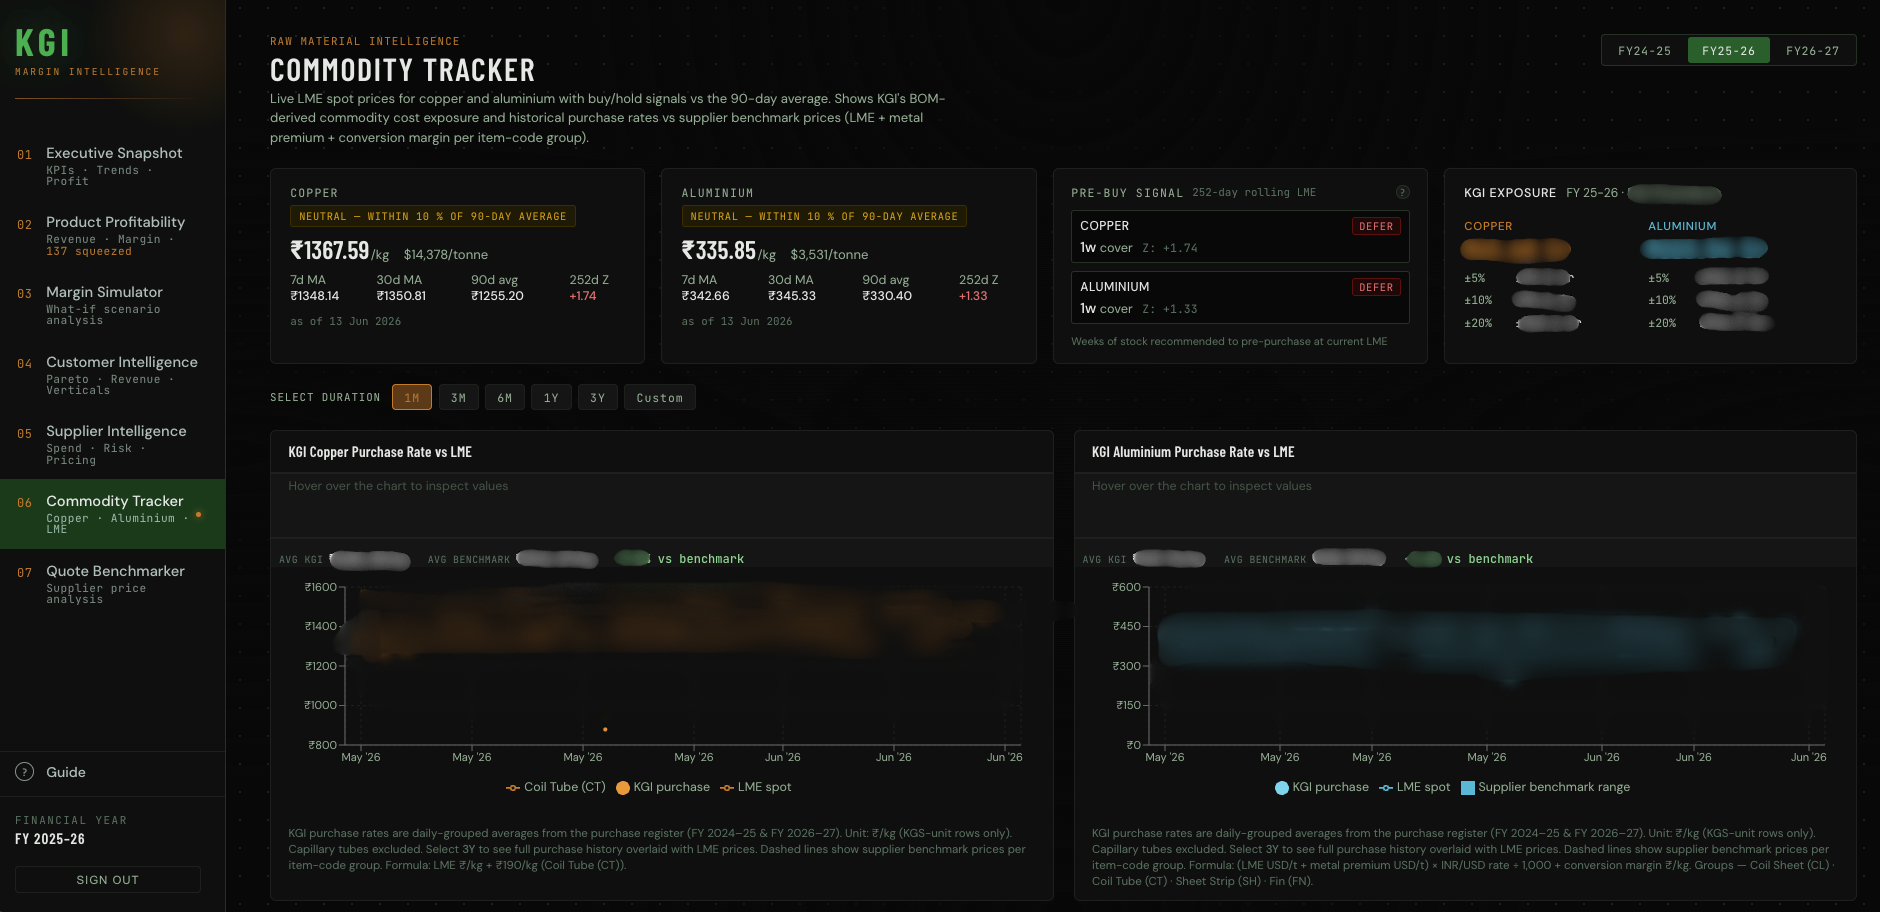
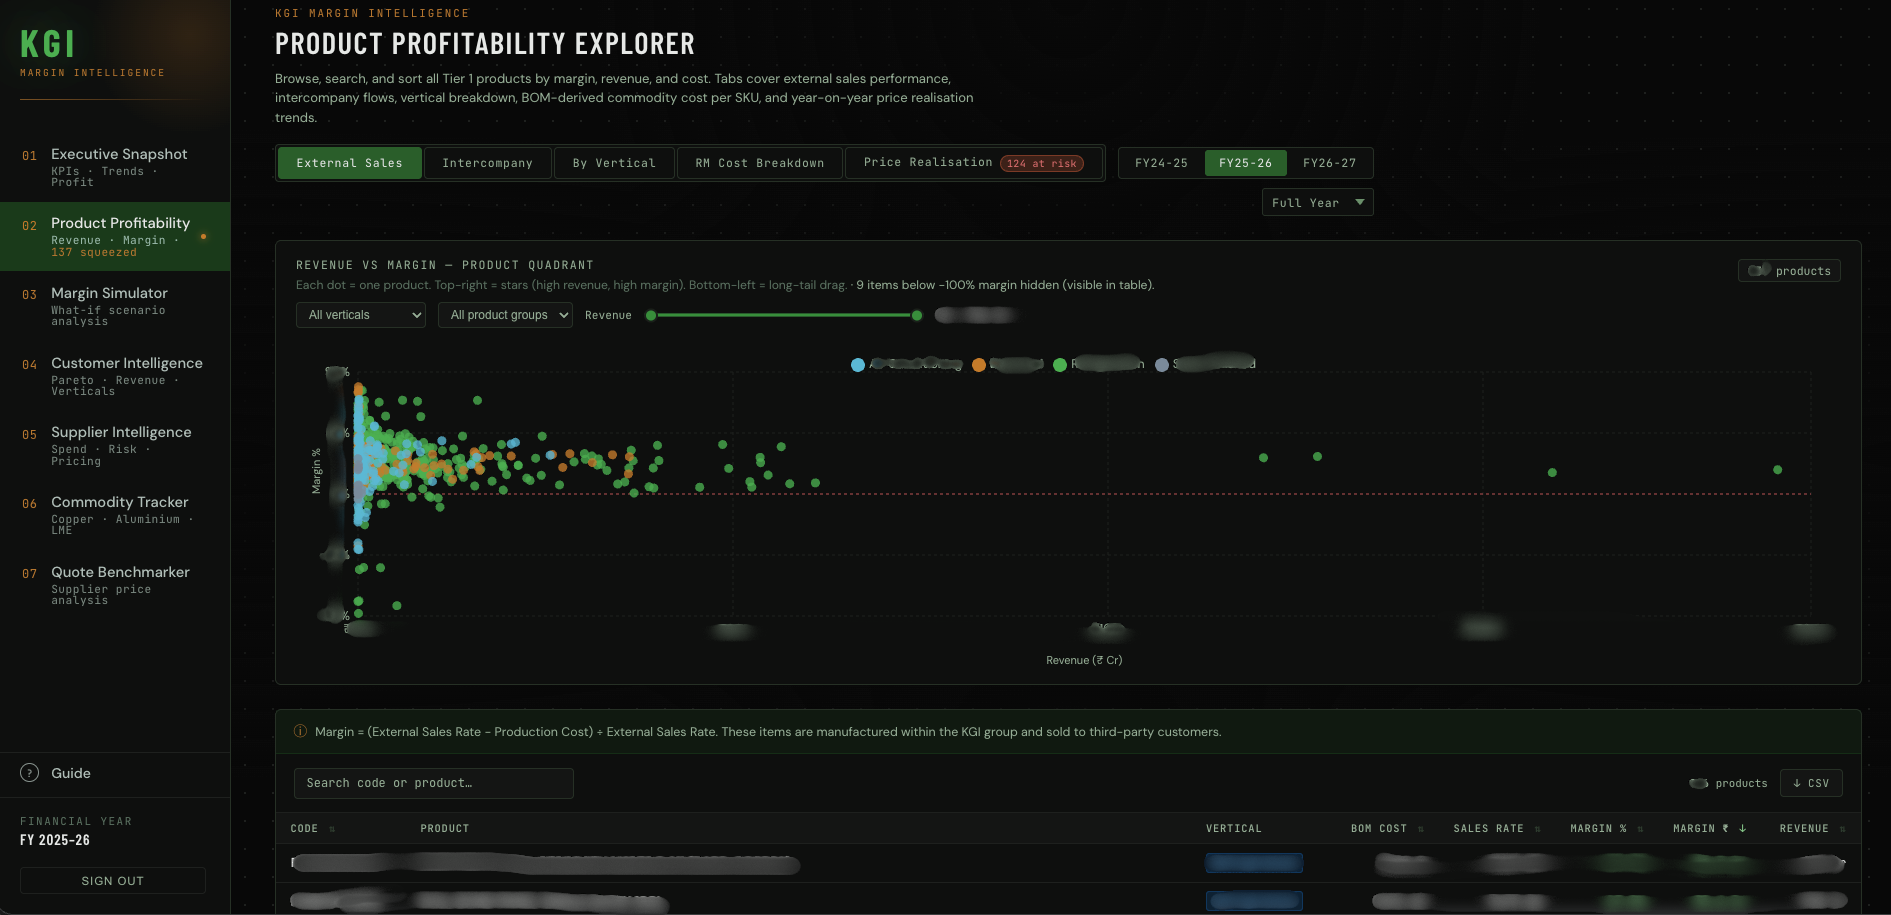
At its simplest, it's one dashboard that answers in seconds what used to take days: which products, customers and suppliers make or lose money, and where the margin is really coming from. It rebuilds itself automatically every night, so the figures are current every morning without anyone touching a spreadsheet. Each team sees its own version — directors get the headline picture, purchasing gets the buy-side detail — and a live feed of commodity prices flags when the cost of raw materials like copper and aluminium is about to move against the business.
Under the surface it's a full-stack application I designed and built solo. Each night it copies the ERP's data into a local database, recalculates margins across roughly half a million transactions, and serves the results through a fast API to a web app of seven role-gated views. The interesting engineering is in the costing: because the ERP stores a product's cost in four places that disagree, a single function decides — for each product, in each period — which figure is most trustworthy, then generates the database query from that choice. Every screen, label and footnote derives from that one function, so the numbers can't quietly contradict each other anywhere in the system. The whole thing runs unattended as a service on the client's own on-premises server.
Tech stack
Architecture
How a night's data becomes a live dashboard, left to right — from the ERP, through the overnight rebuild and the costing logic, out to each team's view.
The hard part
The hardest part wasn't building the screens — it was deciding which number to believe. The ERP records the cost of making a product in four different ways, and which one is reliable changes from product to product and quarter to quarter. Rather than hard-code a guess, I wrote a single function — cost_method(fy, quarter) — that picks the best available source for a given product and period and generates the matching database query. Everything downstream is built from that one function, so the whole system can never drift out of agreement with itself.
A subtler problem was telling real sales apart from internal transfers between the client's own sites. The ERP flags internal sales but not internal purchases, so those had to be identified by matching supplier names — an asymmetry baked into the data itself rather than a bug to fix. Handling it cleanly, instead of papering over it, was the difference between margins you can trust and margins that just look right.
Screenshots
Outcomes
- Live in production — the overnight rebuild has run unattended for years, across multiple years of accounts
- Answers come back in under a second, even across 500,000+ transactions
- Flags good and bad moments to buy copper and aluminium by comparing today's price against its own recent trading history (a rolling 252-day window)
- Directors, marketing and purchasing each get their own secure view of the data
- The business now sets and tracks its annual team targets directly from the dashboard