Procurement & Margin Intelligence Dashboard
A single dashboard that shows an 11-site manufacturer where its margin comes from, rebuilt automatically every night and checked line by line against its audited accounts. Built and run solo; the business now sets its annual targets through it.
The problem
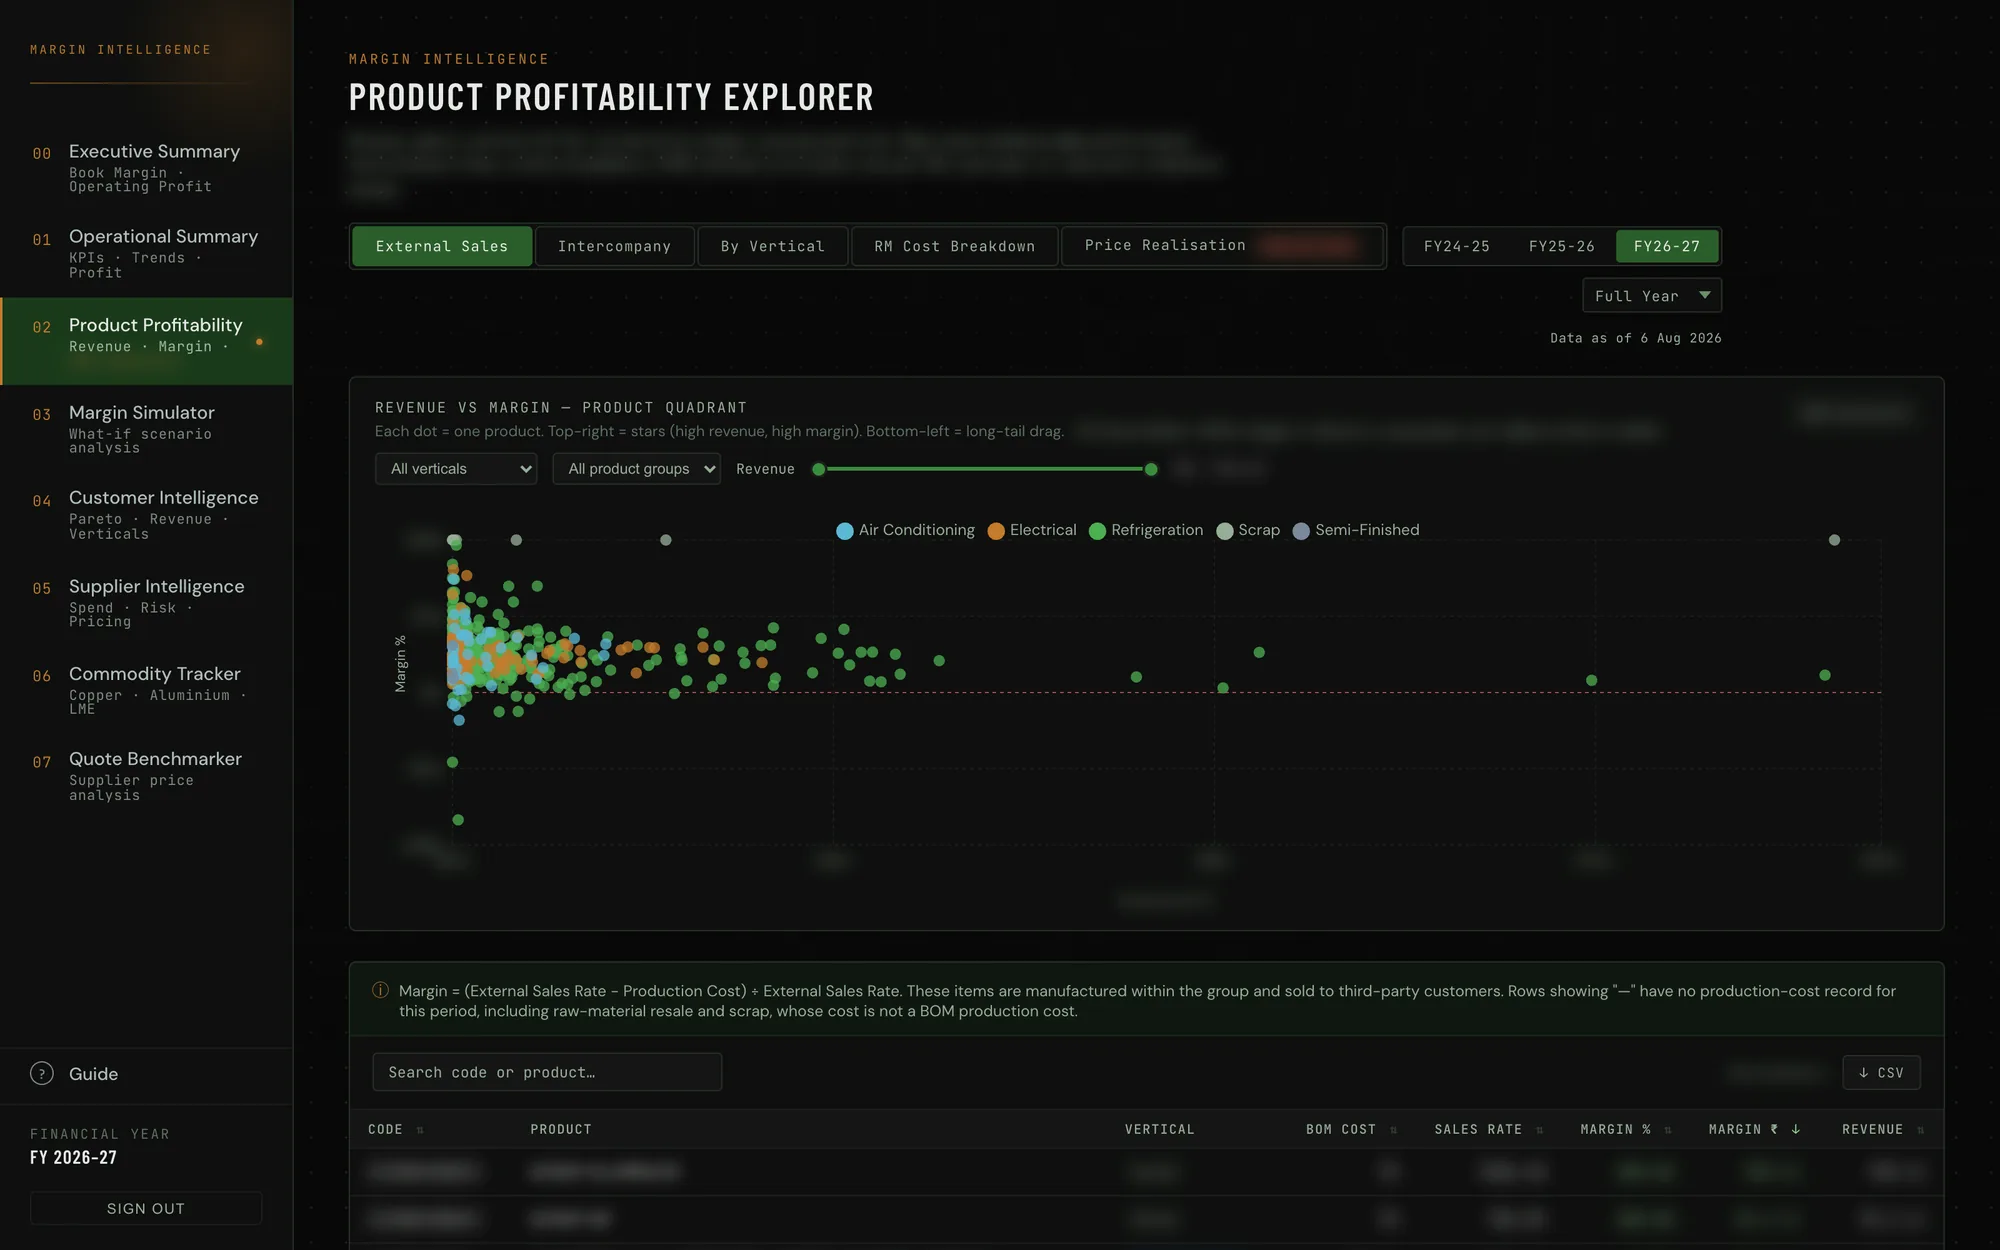
A multi-site manufacturer couldn’t answer a simple-sounding question: which of its products make money? Its ERP, the core business software, recorded the cost of making each product in several places, and production costs, stock-ledger costs and transfers between sites rarely agreed. Comparing margins meant days of spreadsheet work, and there was no in-house IT team to fix it.
What I built
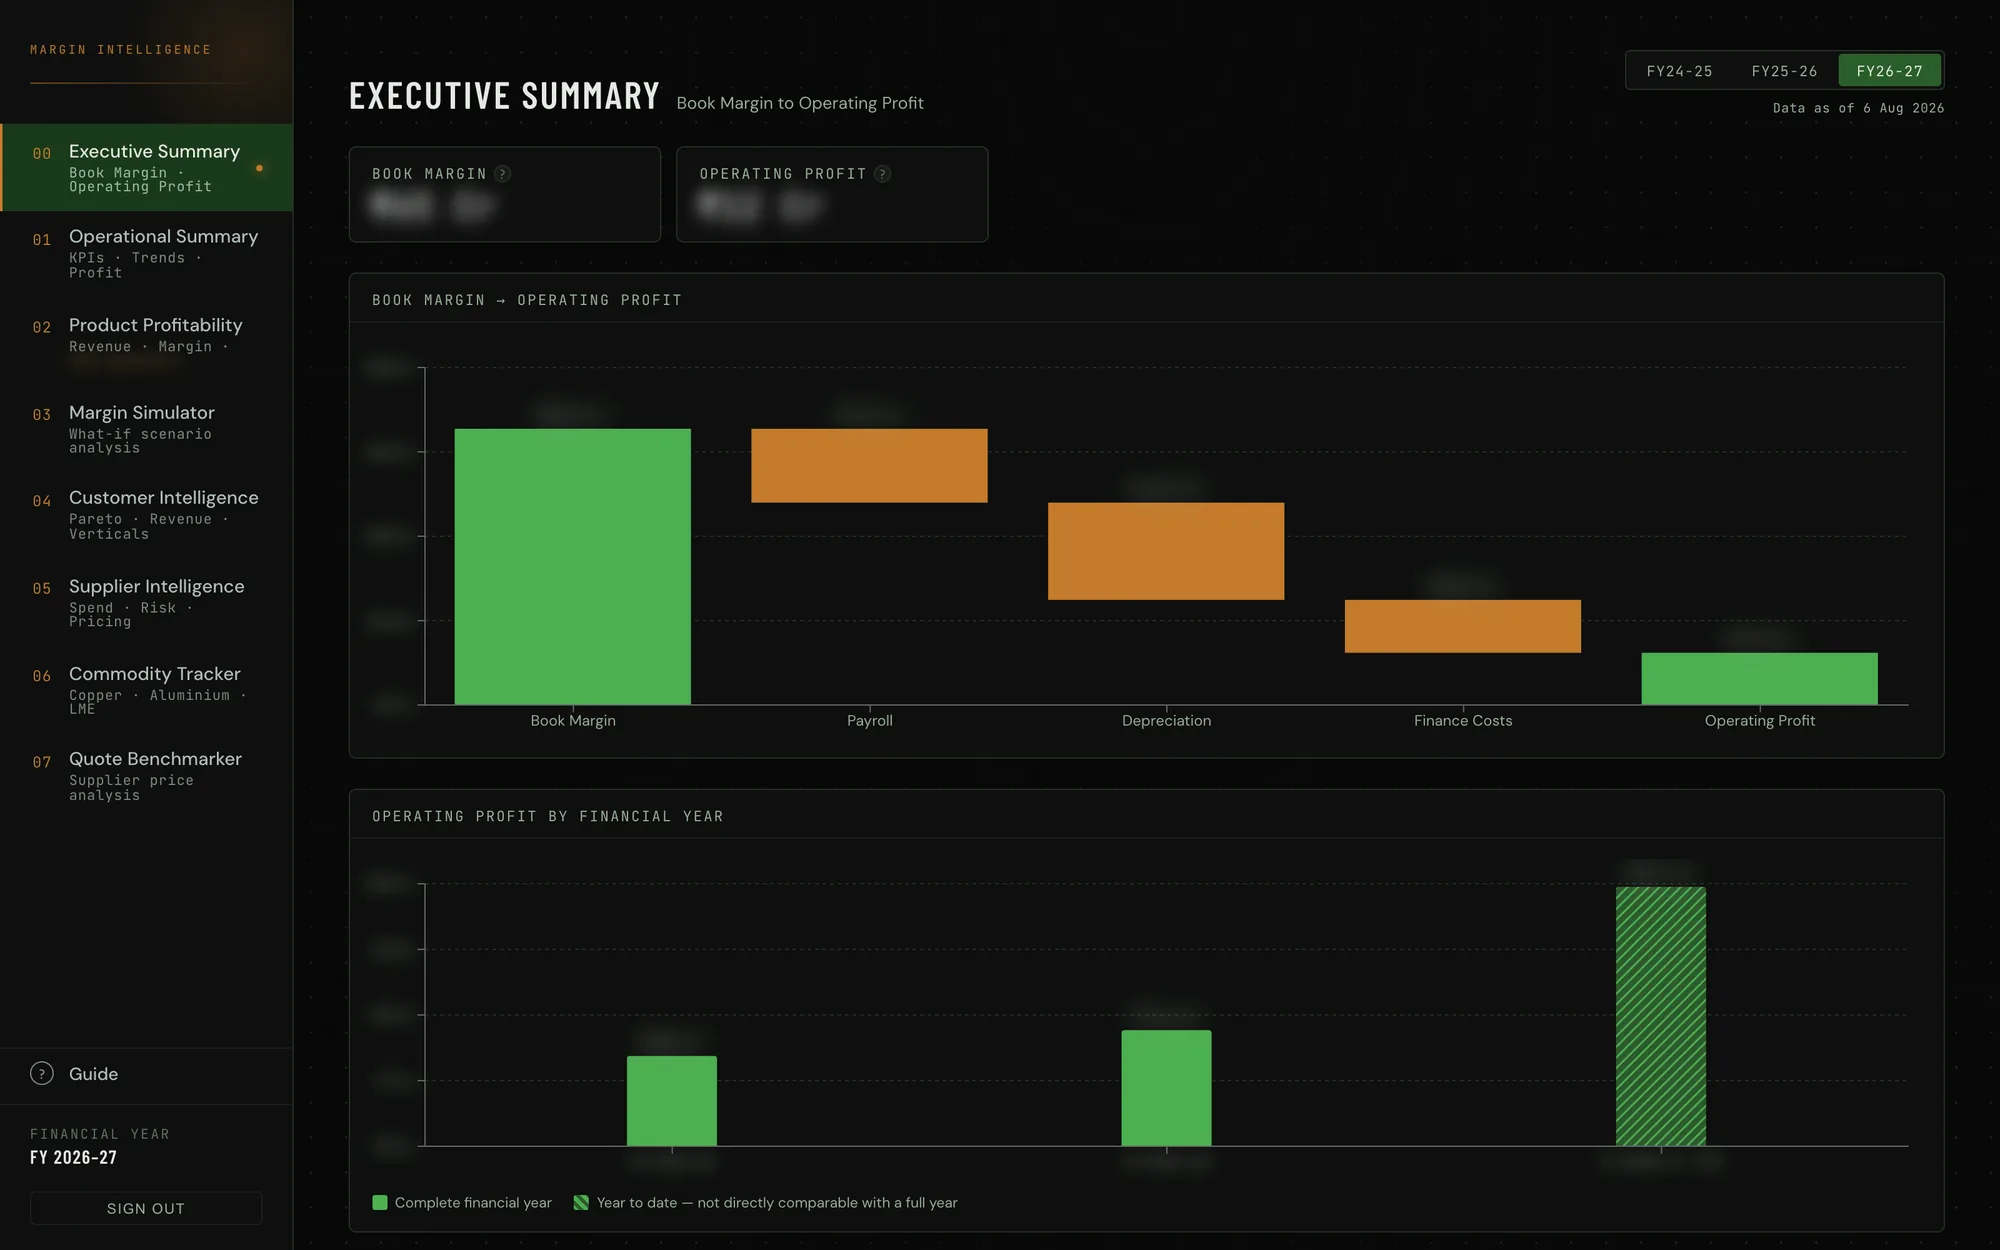
One dashboard that answers in seconds what used to take days: which products, customers and suppliers make or lose money, and why. It rebuilds itself every night, so each morning’s figures are current without anyone touching a spreadsheet. Directors get the headline picture, purchasing the buy-side detail, and a commodity feed flags when copper and aluminium prices are about to move against the business. I designed and built it solo. It runs unattended as a service on the manufacturer’s own server, with 154 automated tests guarding the costing and stock calculations.
Tech stack
Architecture
Earning trust
People set their targets through it, so it has to be right. The manufacturer’s IT and accounting teams have every table and calculation behind it, and since August each calculation goes to accounting as the SQL, the tables in Excel and a short note on the method. That month ran as one accuracy programme. Closing stock, which existed nowhere, is now derived in SQL. About a tenth of revenue had no production-cost record and was being silently dropped; it now shows with its cost left blank rather than estimated. Goods received but not yet invoiced became their own term in the margin chain. Checked line by line against the official profit and loss statements, the dashboard needed only very small changes.
In September a cross-check against the factory’s machine records found the largest costing error so far: a whole-year average cost made products that barely broke even look comfortably profitable. It was fixed, explained to accounting and deployed within four days.
The hard part
The hardest part was deciding which number to believe. The ERP records a product’s cost four different ways, and which one was reliable changed from year to year. Rather than hard-code a guess, I wrote one function, cost_method(fy, quarter), that picks the source for a period and writes the matching query. Everything downstream is built from it, so the system can’t disagree with itself. Once real production costs covered every year, the two in-between reconstructions were deleted: a figure is now either the real cost or a labelled estimate.
One quirk lives in the calendar: purchases post in month-end lumps while sales post daily, so the margin reads several points high early in a month. Only month-end figures compare with each other, so the headline page is pinned to them.
Built on the same data
Once the ERP data could be trusted, it fed two more tools, both kept off the production server until the people who would use them have checked the output.
Factory machine records. One plant has five to six years of per-machine production data. Joined to the ERP product by product, the machine counts agree with the accounts’ stage quantities to within 3.5% on five products: the first check of shop-floor numbers against a system that shares nothing with the machines. The join also showed that about half the plant’s output leaves as part-finished goods sold within the group, which a finished-goods view had missed. The gaps where data is still captured by hand are with the business, and nothing is wired in until they are closed.
Stock health planner. Built in September 2026 on a full stock-ledger extract, and reconciled to the ERP’s monthly totals to within ₹1 for every month, a check that runs as a test. It finds idle and wasted stock, most of it a cash question rather than a margin one, and it says so. The lists are with purchasing for review before any of it is automated.
Screenshots
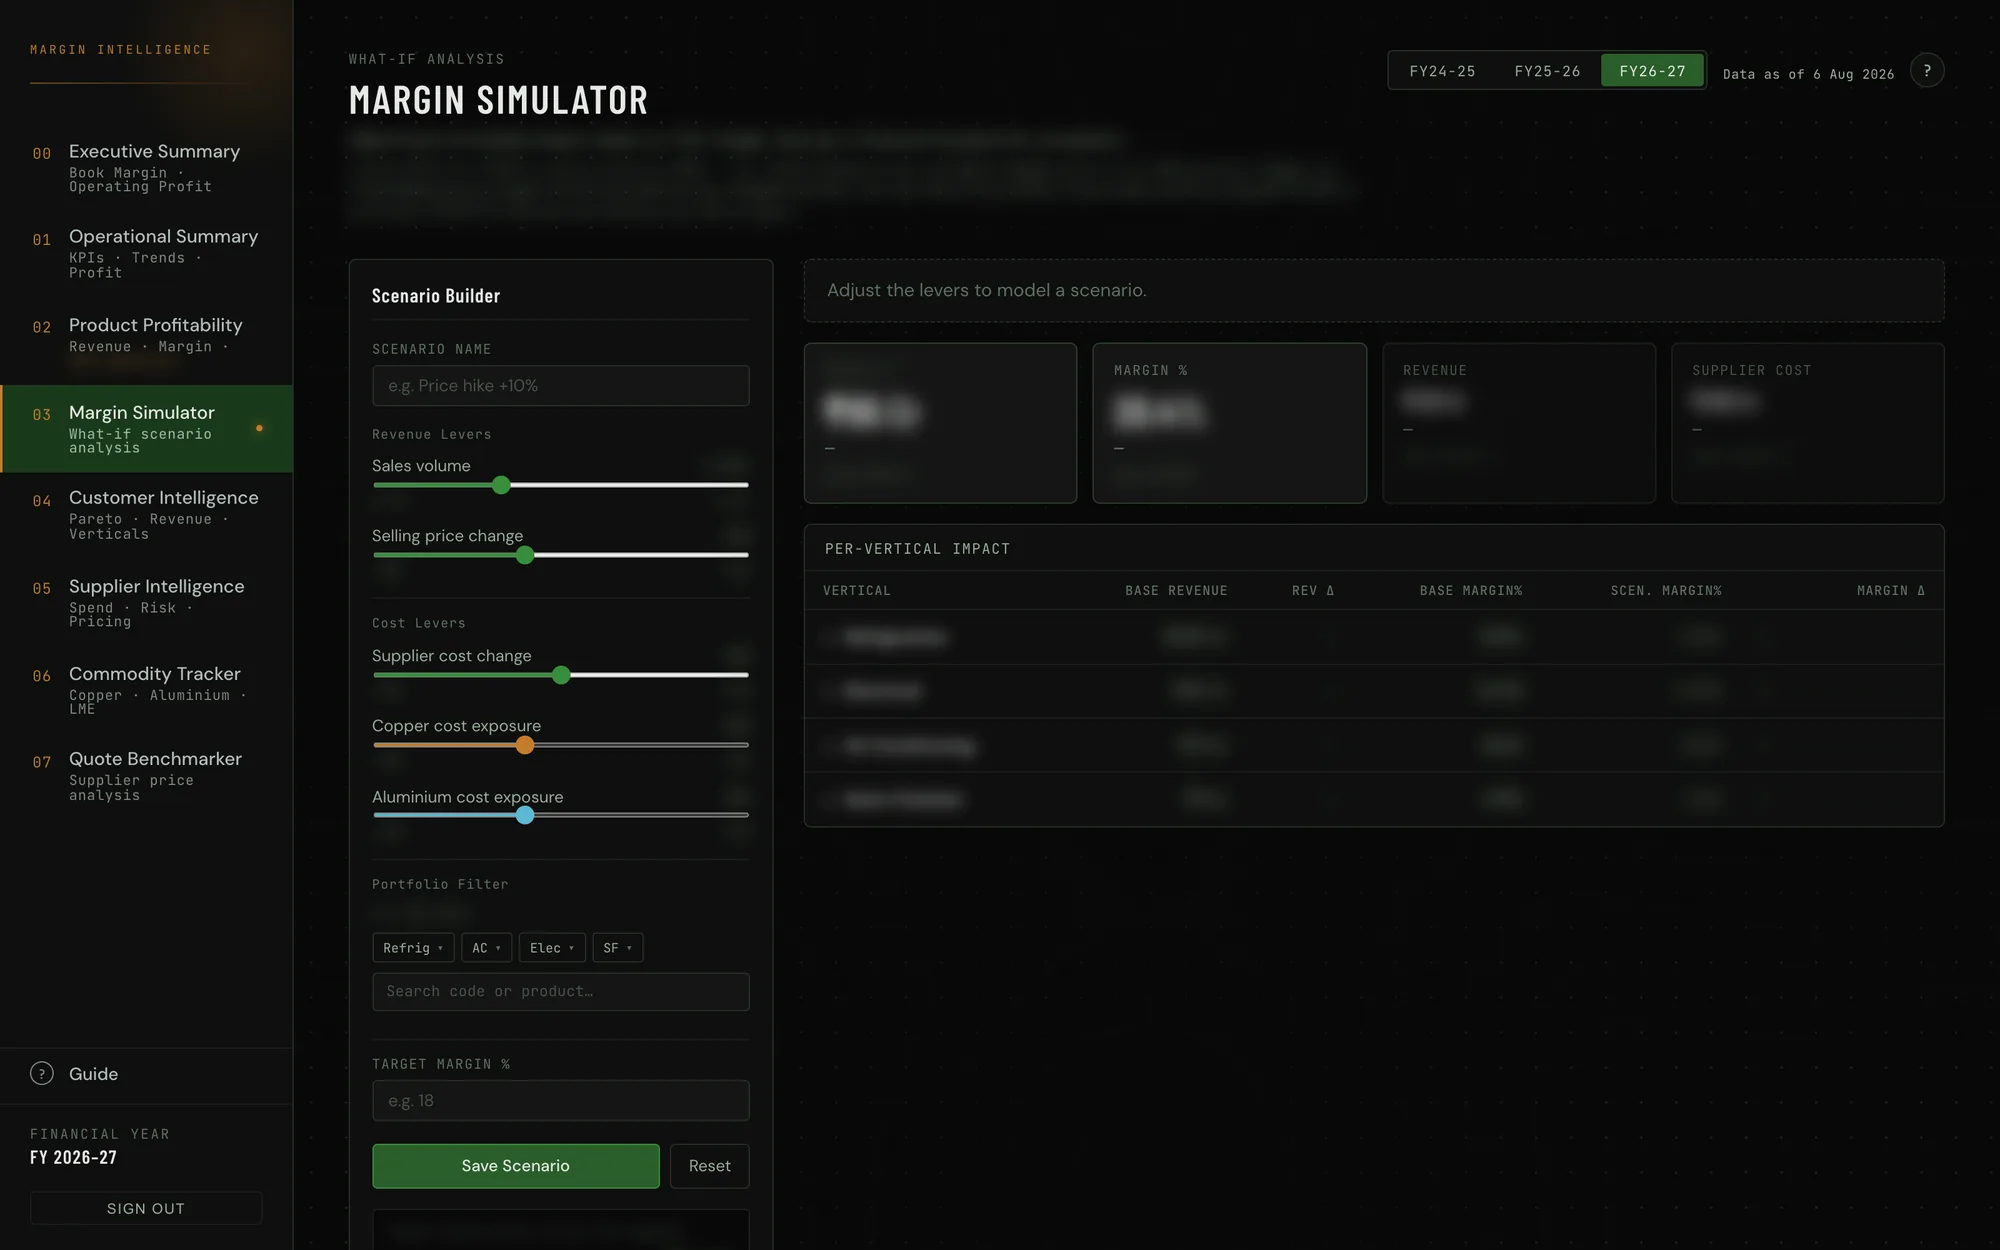
Captured from a local copy with the manufacturer’s name removed and every figure and name blurred.
Outcomes
- In production on the manufacturer’s own server since April 2026, rebuilt unattended every night
- Since May 2026 the executive, marketing and purchasing teams set and track their annual KPIs through it
- Reconciled line by line against the official profit and loss statements in August 2026, with only very small changes
- Flags good and bad moments to buy copper and aluminium by comparing today’s price with the past year’s trading
- Its data now feeds two more tools, for factory output and stock health